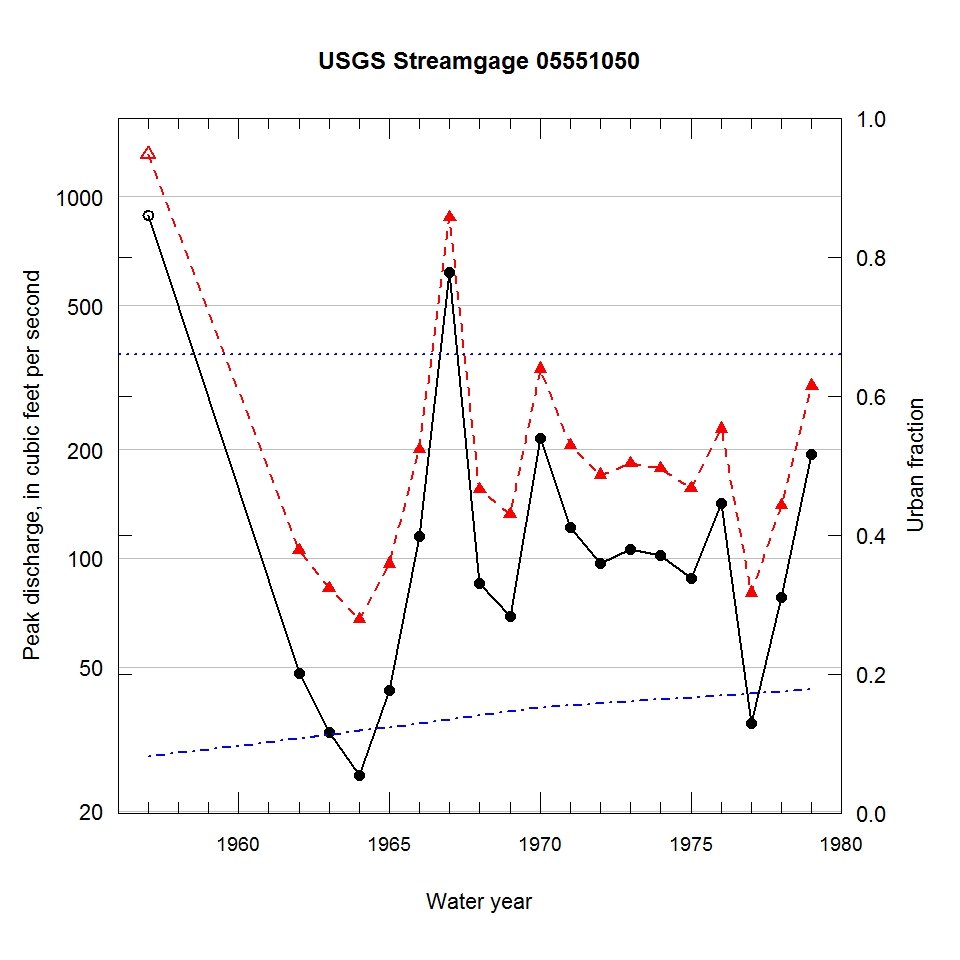
Observed and urbanization-adjusted annual maximum peak discharge and associated urban fraction and precipitation values at USGS streamgage:
05551050 NORTON CREEK NEAR WAYNE, IL


| Water year | Segment | Discharge code | Cumulative reservoir storage (acre-feet) | Urban fraction | Precipitation (inches) | Observed peak discharge (ft3/s) | Adjusted peak discharge (ft3/s) | Exceedance probability |
| 1957 | 1 | 7 | 0 | 0.081 | 2.267 | 890 | 1310 | 0.000 |
| 1962 | 1 | -- | 0 | 0.107 | 0.289 | 48 | 105 | 0.842 |
| 1963 | 1 | -- | 0 | 0.112 | 1.223 | 33 | 82 | 0.928 |
| 1964 | 1 | -- | 0 | 0.118 | 0.683 | 25 | 68 | 0.956 |
| 1965 | 1 | 2 | 0 | 0.124 | 0.134 | 43 | 96 | 0.881 |
| 1966 | 1 | -- | 0 | 0.129 | 1.366 | 115 | 200 | 0.356 |
| 1967 | 1 | -- | 0 | 0.135 | 1.167 | 617 | 876 | 0.000 |
| 1968 | 1 | -- | 0 | 0.141 | 1.487 | 85 | 155 | 0.587 |
| 1969 | 1 | -- | 0 | 0.146 | 1.274 | 69 | 132 | 0.715 |
| 1970 | 1 | -- | 0 | 0.152 | 1.417 | 214 | 334 | 0.071 |
| 1971 | 1 | -- | 0 | 0.155 | 0.357 | 122 | 205 | 0.334 |
| 1972 | 1 | -- | 0 | 0.158 | 0.562 | 97 | 170 | 0.499 |
| 1973 | 1 | -- | 0 | 0.161 | 1.372 | 106 | 183 | 0.436 |
| 1974 | 1 | -- | 0 | 0.164 | 1.197 | 102 | 177 | 0.467 |
| 1975 | 1 | -- | 0 | 0.167 | 0.036 | 88 | 156 | 0.583 |
| 1976 | 1 | -- | 0 | 0.169 | 1.099 | 142 | 228 | 0.244 |
| 1977 | 1 | -- | 0 | 0.172 | 0.854 | 35 | 80 | 0.932 |
| 1978 | 1 | -- | 0 | 0.175 | 1.357 | 78 | 140 | 0.665 |
| 1979 | 1 | -- | 0 | 0.178 | 0.332 | 194 | 300 | 0.103 |

